EKKO_Project is the all-inclusive software solution for managing, displaying, processing and interpreting GPR data.
Once the Ground Penetrating Radar (GPR) data collection in the field is complete, the next step is to pull out the key information and images and generate a final report.
The EKKO_Project software makes complex GPR analysis easy with intuitive tools to organize, edit, process and plot your GPR data. Powerful visualization, analysis and integration tools allow you to quickly and easily produce impressive reports.
EKKO_Project: From field to finished report
EKKO_Project consists of a base program with optional modules. The base package provides file organization, quick visualization of your project information in a single window and automated reporting.
EKKO_Project works with project .gpz files automatically exported from current GPR systems. An embedded database structure allows all GPR data and ancillary files (GPS, topography, photos, notes, etc.) to be housed in a single .gpz file for a specific project. A project file could contain a single GPR line or several hundred lines from a complex survey. Legacy .dt1 and .hd files can also be imported. Any available project information can easily be added to the .gpz file, providing a single point for all your survey information.
The main user interface consists of a number of window panes to provide an overview of the project.
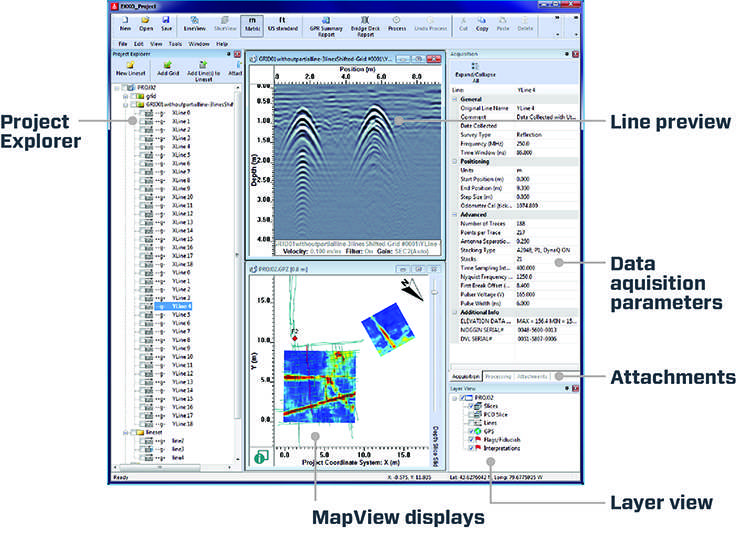
Project Explorer:
- Displays all Ground-penetrating radar (GPR) lines and grids in the project
- GPR lines can be grouped into linesets or grids
- Add, copy, delete and rename data
- Select multiple GPR lines for batch processes
Line preview:
Display the ground penetrating radar (GPR) line selected in Project Explorer.
Attachments:
GPS, topography, photos, videos, voice recordings, field notes, sketch maps, etc.
Layer view:
Select layers to display in MapView and Line Preview
Data acquisition parameters:
All data file attributes are immediately visible, including date of collection, system type, survey type, postioning and advanced parameters.
MapView displays:
- Grid lines
- GPS paths
- Flags added in the field
- Field and Point interpretations
- Depth slices generated by data acquisition hardware or processed with SliceView
- Slice through all grids simultaneously, regardless of orientation
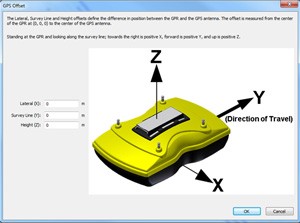
GPS:
- GPR Lines and Grids appear in correct location and orientation
- Define Project to Global coordinates
- Correct GPS for offsets from the GPR sensor
Reporting:
Create superior deliverables with your company logo easily using the GPR summary report button. Combine screenshots of your data and attached photographs to quickly document your insights.
Or output data files in a spreadsheet (.csv), Google Earth (.kmz) or AutoCAD (.dxf) format listing fiducials and interpretations that are easily imported by GIS, CAD and other software.

EKKO_Project From Field to Finish report Easily create GPR Summary Reports.
EKKO_Project Optional Modules
LineView Module
Modify and display GPR lines and export images in a number of graphic formats.

Interpretation Module
The Interpretation Module provides all the functionality of EKKO_Interp along with the reporting and file management of EKKO_Project.
Interpretation Module: Add interpretations to GPR Lines and plot in MapView, GIS or Google Earth™.
SliceView Module
Process grids and line data into depth slices to visualize underground objects. Export 3D volume data into 3D visualization programs.

SliceView Module: depth slice to visualize underground objects.
SliceView 3D Visualization
SliceView supports 3D volume data in HDF and CSV file formats for easy use in third-party 3D visualization programs such as Voxler.
Processing Module
Filter, migrate and edit GPR lines to emphasize targets.

GPR data processing: Average Time Amplitude Plot, Average Frequency Spectrum Plot, Trac Plot
The complete EKKO_Project Suite with Interpretation, SliceView, and Processing Modules represents a new realm of GPR data analysis. The Interpretation Module provides all the functionality of EKKO_Interp along with the reporting and file management of EKKO_Project.
Bridge Deck Condition Report Module
The Bridge Deck Condition Report outputs in a report, a GPR Response Amplitude map image and the statistical summary of all the picked rebar in a reinforced concrete structure.
Pavement Structure Report Module
The Pavement Structure Report module outputs in a report, the pavement thickness charts of all the layers added to the GPR Lines.
Installation Requirements
Operating System: Windows 7 or later
CPU: minimum 2GHz
Memory: minimum 2GB RAM
Screen Resolution: minimum 1024×768
Comparison to earlier software packages:
For users of previous software, EKKO_View, EKKO_View Deluxe and EKKO_Interp, EKKO_Project represents the evolution to the next generation integrated software solution:
- EKKO_Project Base delivers enhancements like file organization and GPS integration to EKKO_View
- Adding the Processing Module to EKKO_Project delivers a new, advanced version of EKKO_View Deluxe processing
- The Interpretation Module provides all the functionality of EKKO_Interp along with the reporting and file management of EKKO_Project
EKKO_Project Optional Modules:
LineView Module
The LineView module is used for modifying and displaying GPR lines.
Plot GPR lines with:
-
- Gain
- Background Subtraction filter
- Axes
- Distance Units
- Fonts
- Topographic corrections

Topographic corrections
-
- Color or Wiggle Trace Palettes

Color or Wiggle Trace Palettes

Multiple Color Palettes
-
- Add legends with data display details

Legend with data display details
-
- perform hyperbola velocity calibration

Hyperbola Velocity Calibration
Save GPR lines to:
- Graphics files(.jpg, .bmp, etc.)
- GPR Summary Report
- Clipboard
- Printer
Image options:
- Zoom & Pan
- Display multiple lines at once
- Link parallel GPR lines to scroll and zoom together
- Add an Interpretation to multiple GPR lines at the same time (requires Interpretation module)
- Use the mouse cursor to see the Latitude–Longitude of any point on the GPR line
- Quickly launch Google Earth™ to pinpoint the location of a GPR target

Quickly launch Google Earth™ to pinpoint the location of a GPR target
Interpretation Module
The Interpretation Module works within LineView:
- Users can interactively add localized targets, layers, labels and identifiers on the GPR lines
- All interpretations are stored in the .gpz database
- Point interpretations appear in the MapView window
- All spatial information is integrated with records stored within the database
Types of Interpretations:
- Points – Defines hyperbolas and point targets
- Polylines – Defines continuous or discontinuous boundaries
- Boxes – Defines a rectangular box around an area of interest
- Annotations – Text pointing to a specific location in the data image

Assisted picking of hyperbolas
Editing tools allow all interpretations to be inserted, deleted or moved. Each interpretation has automatic or user-defined properties like color, style, markers and marker size which make it easy to distinguish between them. Often-used interpretations can become “templates” available for new projects. For example, if your interpretation is a red-colored polyline called “Bottom of Concrete” and you want to use it with other projects, make it a template.
Interpretations can exported in different ways:
1) As an Project Report: CSV (Comma Separated Values) files with the quantitative values for the interpretations, i.e. positions along the GPR line, GPS (if available), depth, time, signal amplitude

CSV file
2) Google Earth Report: KMZ files are plotted in Google Earth

KMZ file
3) AutoCAD: DXF file that can be imported into CAD and GIS software

DXF file
4) MapView display of Point Interpretations and Fiducials

MapView display
5) Graphic image file (JPG, BMP, TIF, etc.) of the GPR line with GPR data and interpretations superimposed.

Graphic image file with GPR data and interpretations superimposed
6) Graphic image file (JPG, BMP, TIF, etc.) of the interpretations only

Graphic image file with the interpretations only
7) Extract polyline interpretations to generate surface plots in third–party software

SliceView Module
The SliceView module creates GPR depth slice maps quickly and easily. Using the systematic grid data acquisition process common to pulseEKKO, Noggin, LMX or Conquest systems, images at multiple depths are generated in minutes.
SliceView features:
- Display multiple cross-sections and depth slices
- Hyperbola-fitting tool for velocity estimates
- On-screen tape measure
- User-defined depth slice thickness
- Automatic grid creation based on GFP files created during acquisition
- Incorporate GPS coordinates on depth slice outputs
- Legends for depth slice and cross-section information
- Display multiple grids simultaneously
- Simple switching between metric and imperial units
- Adjustable resolution to optimize processing
- Support for large grids
- Merging of bi-directional and dual polarization data
- Superimpose depth slices over Google Earth ground images(grids only)
SliceView provides examination of multiple depth slices, selection and viewing of cross-sections, choice of processing streams and optimization of gain, image contrast, sensitivity and color.

Define the depth and lateral extent of utilities

Decipher and reveal complex patterns

Display multiple depth slices

Simultaneously view and manipulate depth slices and cross-sections.
SliceView also offers additional exporting options:
- Google Earth KMZ file format
- Comma Separated Values file format (CSV)
- Surfer GRD
- 3D HDF, see SliceView 3D Visualization

Pick and tabulate target points in Excel or other applications.

Automatically launch Google Earth when exporting to kmz file format.
SliceView 3D Visualization
SliceView supports 3D volume data in HDF and CSV file formats for easy use in third-party 3D visualization programs such as Voxler. Voxler provides many display options including volumes, variable-opacity views, isosurfaces and orthogonal or oblique slices, rotation and different colourmaps. Images are saved as graphic image files (BMP, JPG).
3D Visualization of Noggin data:

Volume view

Variable-opacity

Clip planes with isosurfaces
3D Visualization of pulseEKKO PRO data – fanset & foreset bedding from a prograding delta:

Clip plane 1

Clip plane 2

Clip plane 3
Processing Module
The Processing Module provides a range of common GPR signal processing and analysis tools:
- Migration, time and spatial filtering and attribute creation
- Frequently-used processing recipes can be built, stored and re-used
- Processing can be applied to a single GPR line, a selected group or all GPR lines with ease
- Processing can be undone with a single click

Processing module provides a range of signal processing and analysis tools

View a Trace Plot of traces from one or more GPR lines.

View an average trace amplitude plot of one or more GPR lines.

View an amplitude spectrum plot of one or more GPR lines.
Specialized Reporting Modules
Bridge Deck Condition Report Module
The Bridge Deck Condition Report Module requires the Interpretation Module. The Bridge Deck Condition Report outputs, in a report format, a GPR Response Amplitude map image and the statistical summary of all the picked rebar in a reinforced concrete structure. The report includes several fields for the GPR operator to fill in including the survey location, number of lanes and the GPR system used.
Survey Summary
Display key bridge and project information based on operator filled fields
Bridge Deck Condition Report features:
Response Amplitude Maps
Signal attenuation map images are generated by interpolating rebar amplitude values into the gaps between GPR lines. Two types of Response Amplitude displays are available:
- Raw Amplitude Maps – yields GPR signal strength in millivolts (mV)
- Signal Attenuation Maps – presents GPR signal strength in decibels (dB). This is often referred to as a Deterioration Index map. The ‘dB‘ map uses an enhanced version of the processing outlined in ASTM 6087 (Standard Test Method for Evaluating Asphalt-Covered Concrete Bridge Decks Using Ground Penetrating Radar).

Rebar Response Amplitude Map. Higher values (red) indicate areas of higher attenuation which may indicate bridge deck deterioration due to saline intrusion and rebar corrosion.
Amplitude image options:
- User-selectable color palette
- Amplitude range plotted can be set to
- Automatic – full range
- Manual – user sets the range to emphasize high or low amplitude (or attenuation) areas or, to compare maps from more than one bridge deck using the same range
- Export Response Amplitude map image to png., bmp., or jpg. graphic file formats
Statistical Summary
The software automatically generates statistics on the reinforcement depth and spacing, including:
- minimum, maximum and average amplitude
- minimum, maximum and average rebar depth
- minimum, maximum and average rebar spacing

Example of tabulated summary of analyzed data.
Example of an automated report created from EKKO_Project as a PDF document that is easy to share or print.

Example of an automated report created from EKKO_Project as a PDF document that is easy to share.
Export data in CSV format:
Export the calculated amplitude values (in mV or dB) to a .csv file. This allows the user to import the data into third-party software for image generation and further analysis.
This powerful analysis can be used for bridge decks, parking decks, and even walls and floors of concrete buildings.
Pavement Structure Report Module
The optional Pavement Structure Report requires the Interpretation Module. The Pavement Structure Report module outputs in a report format the pavement thickness charts of all the layers added to the GPR Lines. The report includes several fields for the GPR operator to fill in including the road name, number of lanes and the GPR system used.
Pavement Structure Report includes:
Pavement Structure charts for each GPR line. Charts that display the thicknesses of the asphalt and granular layers. These charts are interactive. Place the mouse cursor anywhere on the chart to display the position along the line and depth of each layer at that position. Pavement structure chart displaying the thicknesses of the asphalt and granular layers over a 470 meter length of road. Blank areas indicate areas where confident picks could not be made.

Pavement structure chart displaying the thicknesses of the asphalt and granular layers over a 470 meter length of road. Blank areas indicate areas where confident picks could not be made. These charts are interactive. Place the mouse cursor anywhere on the chart to display the position along the line and depth of each layer at that position.
Statistics:
Including minimum, maximum and average layer thickness for all GPR lines included in the report.

Pavement Structure Report Module: example of tabulated summary of analyzed data. The report can printed directly or to a PDF document.
Example of an automated report created from EKKO_Project as a pdf document that is easy to share:

Export the pavement layer depths to a .csv file. This allows the user to import the data into third–party software for image generation and further analysis.
While the EKKO_Project Pavement Structure Report is designed for typical road survey analysis, the “pavement structure” can take many forms. This analysis and reporting tool can also be applied to any layered structures such as rail beds, runways, water depth and bathymetry, snow and ice thickness, and layered geology.